Tutorial

Workflow

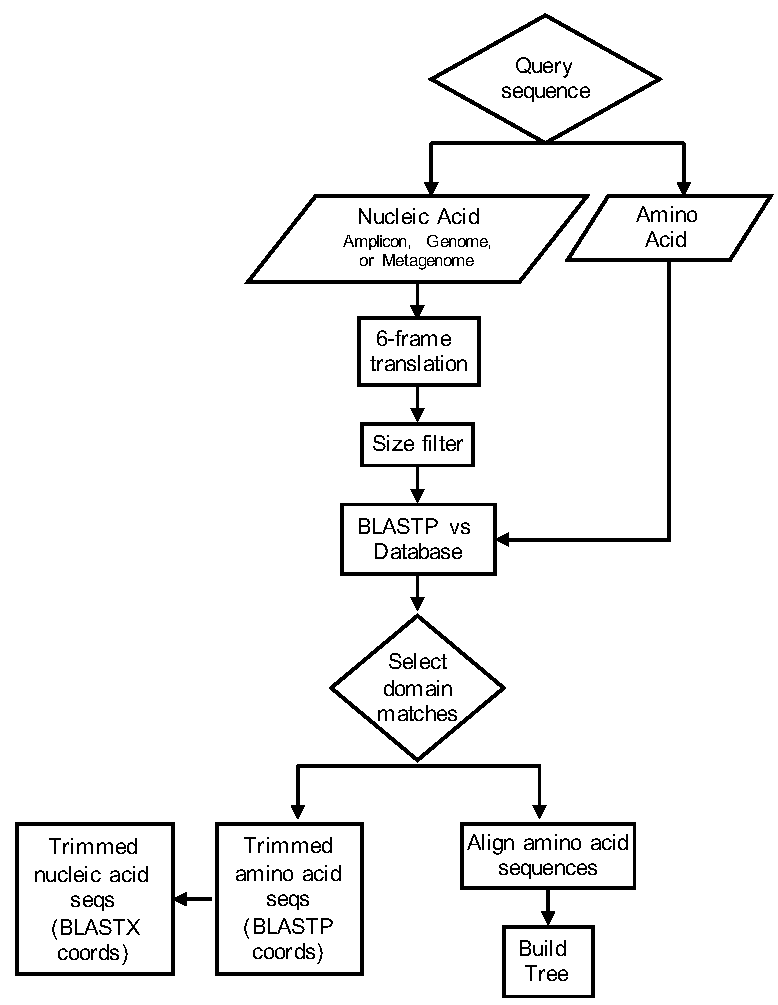
The NaPDoS bioinformatic pipeline is shown in the following diagram. The web interface to this pipeline is divided into four consecutive steps. Click on the link for each step to get detailed instructions.


Web Interface Steps

  1. Preliminary Candidate Screening

  2. BLAST search results

  3. TREE construction

  4. Interpretation of Results

napdos2_flowchart.png

Preliminary Candidate Screening

Basic Procedures

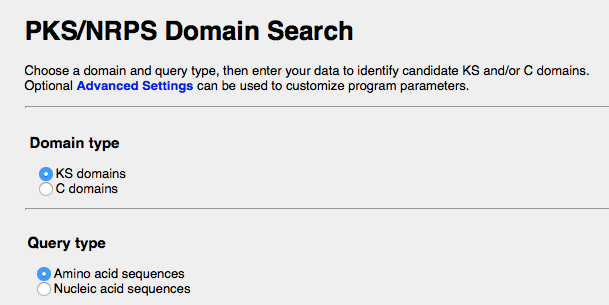
  1. Begin NaPDoS analysis by selecting a domain type (KS or C) and query type (amino acid or nucleic acid).

    • Nucleic acid sequences are translated into predicted amino acids using all 6 possible reading frames.

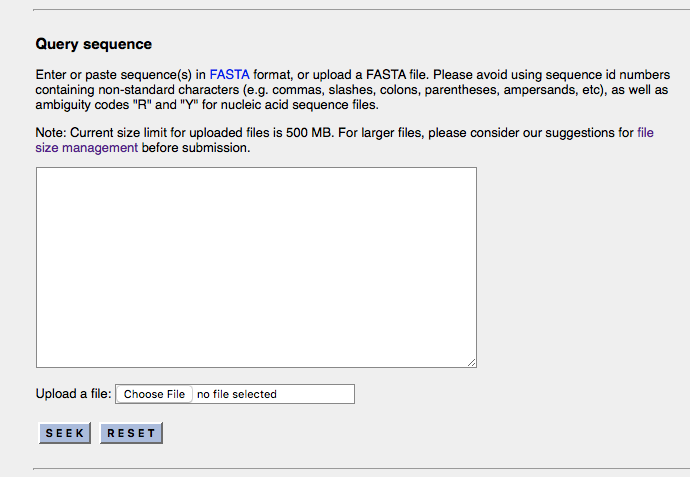
  2. Enter query sequence(s) in fasta format, either by pasting into the text box provided, or uploading a fasta format file.

    • Maximum file size limits are currently set at < 500 MB and < 250,000 individual sequences.

    • For larger data sets, see our file size management recommendations.

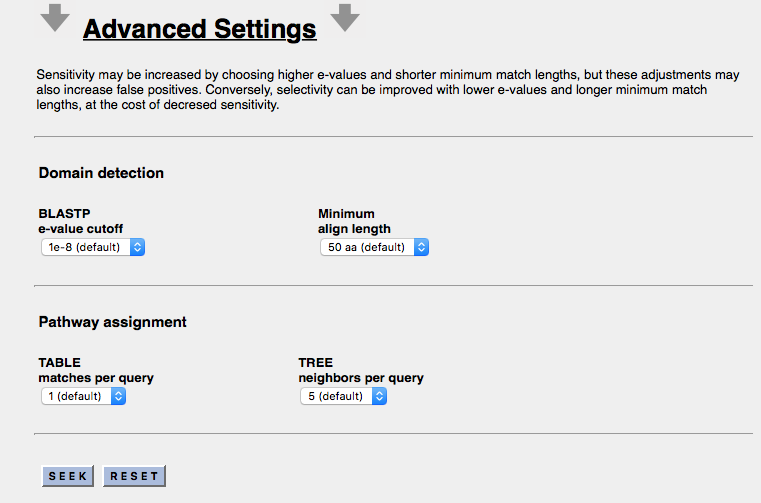
  3. Default parameters can be adjusted by clicking on the Advanced Settings link, but caution should be used in interpreting results obtained with modified parameters.

    • Less stringent BLAST selection criteria may increase false positives.

    • Shorter minimum alignment lengths can decrease sensitivity and classification accuracy, especially for novel domains without exact matches in the reference database.

    • Quantitative validation results supporting these caveats are presented below.
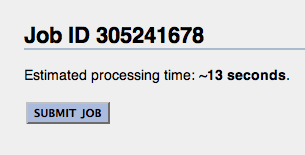
  4. Clicking on the "seek" button brings up a new window showing estimated processing time and search parameters to be used.

    • Analysis does not actually begin until the "submit job" button on this new window is clicked.

run_analysis_screenshot1.png
run_analysis_screenshot2.png
run_analysis_screenshot_advanced.png

BLAST search output

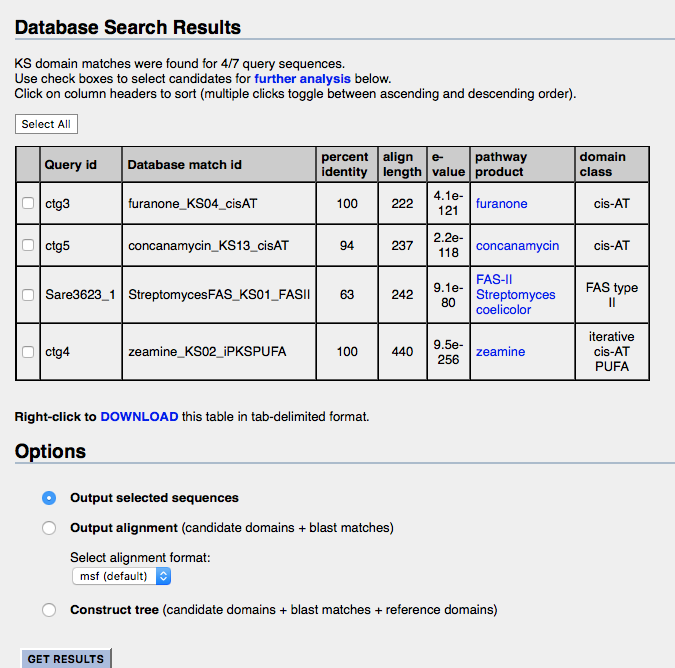
A BLAST search is performed against curated reference database examples to identify matches to known PKS/NRPS pathways. Some suggested guidelines for interpreting BLAST scores are presented below. To proceed with further analysis, one or more candidate sequences must be selected using check boxes. Three different output options are available:
  • Output selected sequences provides trimmed candidate sequences in a fasta file format. These sequences can then be used to perform BLAST searches against the NCBI database (highly recommended), in case similar domains might not yet have been added to NaPDoS.

  • Output alignment will display MUSCLE [1] results for selected candidates and their BLAST matches in MSF, fasta, or clw (Clustal W) or format. The alignment output file can be downloaded for additional offline analysis, for example to make manual adjustments to the alignment, or create custom trees using alternative programs.

  • Construct tree progresses to the next stage of the NaPDoS analysis pipeline, inserting candidate sequences plus their BLAST matches into a manually curated alignment of previously characterized database sequences.

tutorial_domain_search_v2.png

Tree Construction

Tools are provided for construction of phylogenetic trees from predicted KS and C domain sequences, because these trees consistently out-perform simple BLAST searches in predicting the type of compound produced and/or it's relative novelty.

Selected candidate sequences plus their BLAST matches are trimmed and inserted into a manually curated amino acid reference alignment, keeping the original reference alignment intact. This alignment is used to build a tree, which is often more useful than BLAST results alone in predicting whether pathway products for candidate domains are likely to be similar or different from previously known examples [2].

Tree output options

  • Phylogenetic domain trees are built using FastTree to estimate maximum likelihood [3].

  • Tree building does not actually begin until the "submit job" button is clicked.

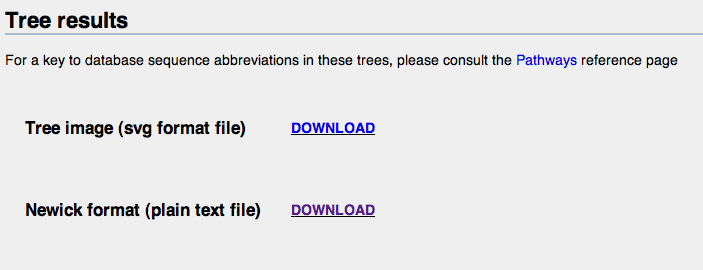
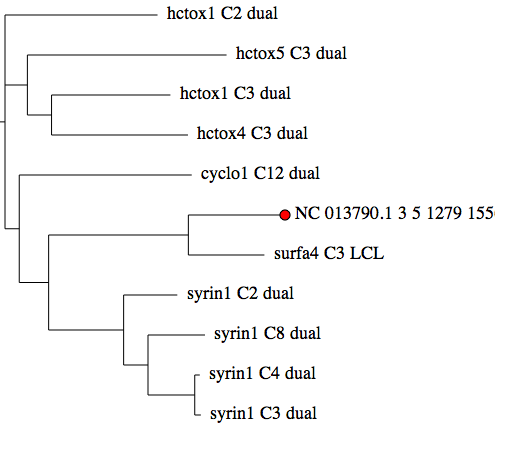
  • After the tree is built, users choose either Newick (plain text) format or an SVG graphics image as an output format.

  • User sequences are highlighted in the SVG graphics image format with red dots, as shown in the example below.

  • FastTree output does not include bootstrap values. However, the program does provide confidence values, which are included in the Newick format output. These values can be visualized by opening the Newick file with most stand-alone GUI interface tree viewing programs, for example the open source software FigTree.


tutorial_svg_tree.png
tutorial_tree_choice.png


Newick format output

(hctox1_C2_dual:1.21247,(hctox5_C3_dual:1.58329, (hctox1_C3_dual:0.94480,hctox4_C3_dual:1 .08446) 0.842:0.19209)0.855:0.17790, (cyclo1_C12_dual:1.37115,((NC_013790. 1_3_5_1279_1556:0.76822,surfa4_C3_LCL:0. 60447)1.000:1.11061, (syrin1_C2_dual:0.42670,(syrin1_C8_dual: 0.45307,(syrin1_C4_dual:0.04019, syrin1_C3_dual:0.04876) 1.000:0.37152)0.909:0.19372)0.995:0. 59611)0.884:0.23364)0.761:0.11321);
SVG format output

tutorial_svg_tree.png

Interpreting Results

BLAST searches

BLAST matches to reference domain sequences provide a good starting point, but are less reliable for predicting domain functionality than multiple sequence alignments and the phylogentic trees built from them. This is because BLAST scores represent average, overall similarities distributed over the entire domain, considering only two sequences at a time, whereas multiple sequence alignments and tree topologies combine information from many sequences together to reveal relationships based on more specific, potentially localized features they may have in common.

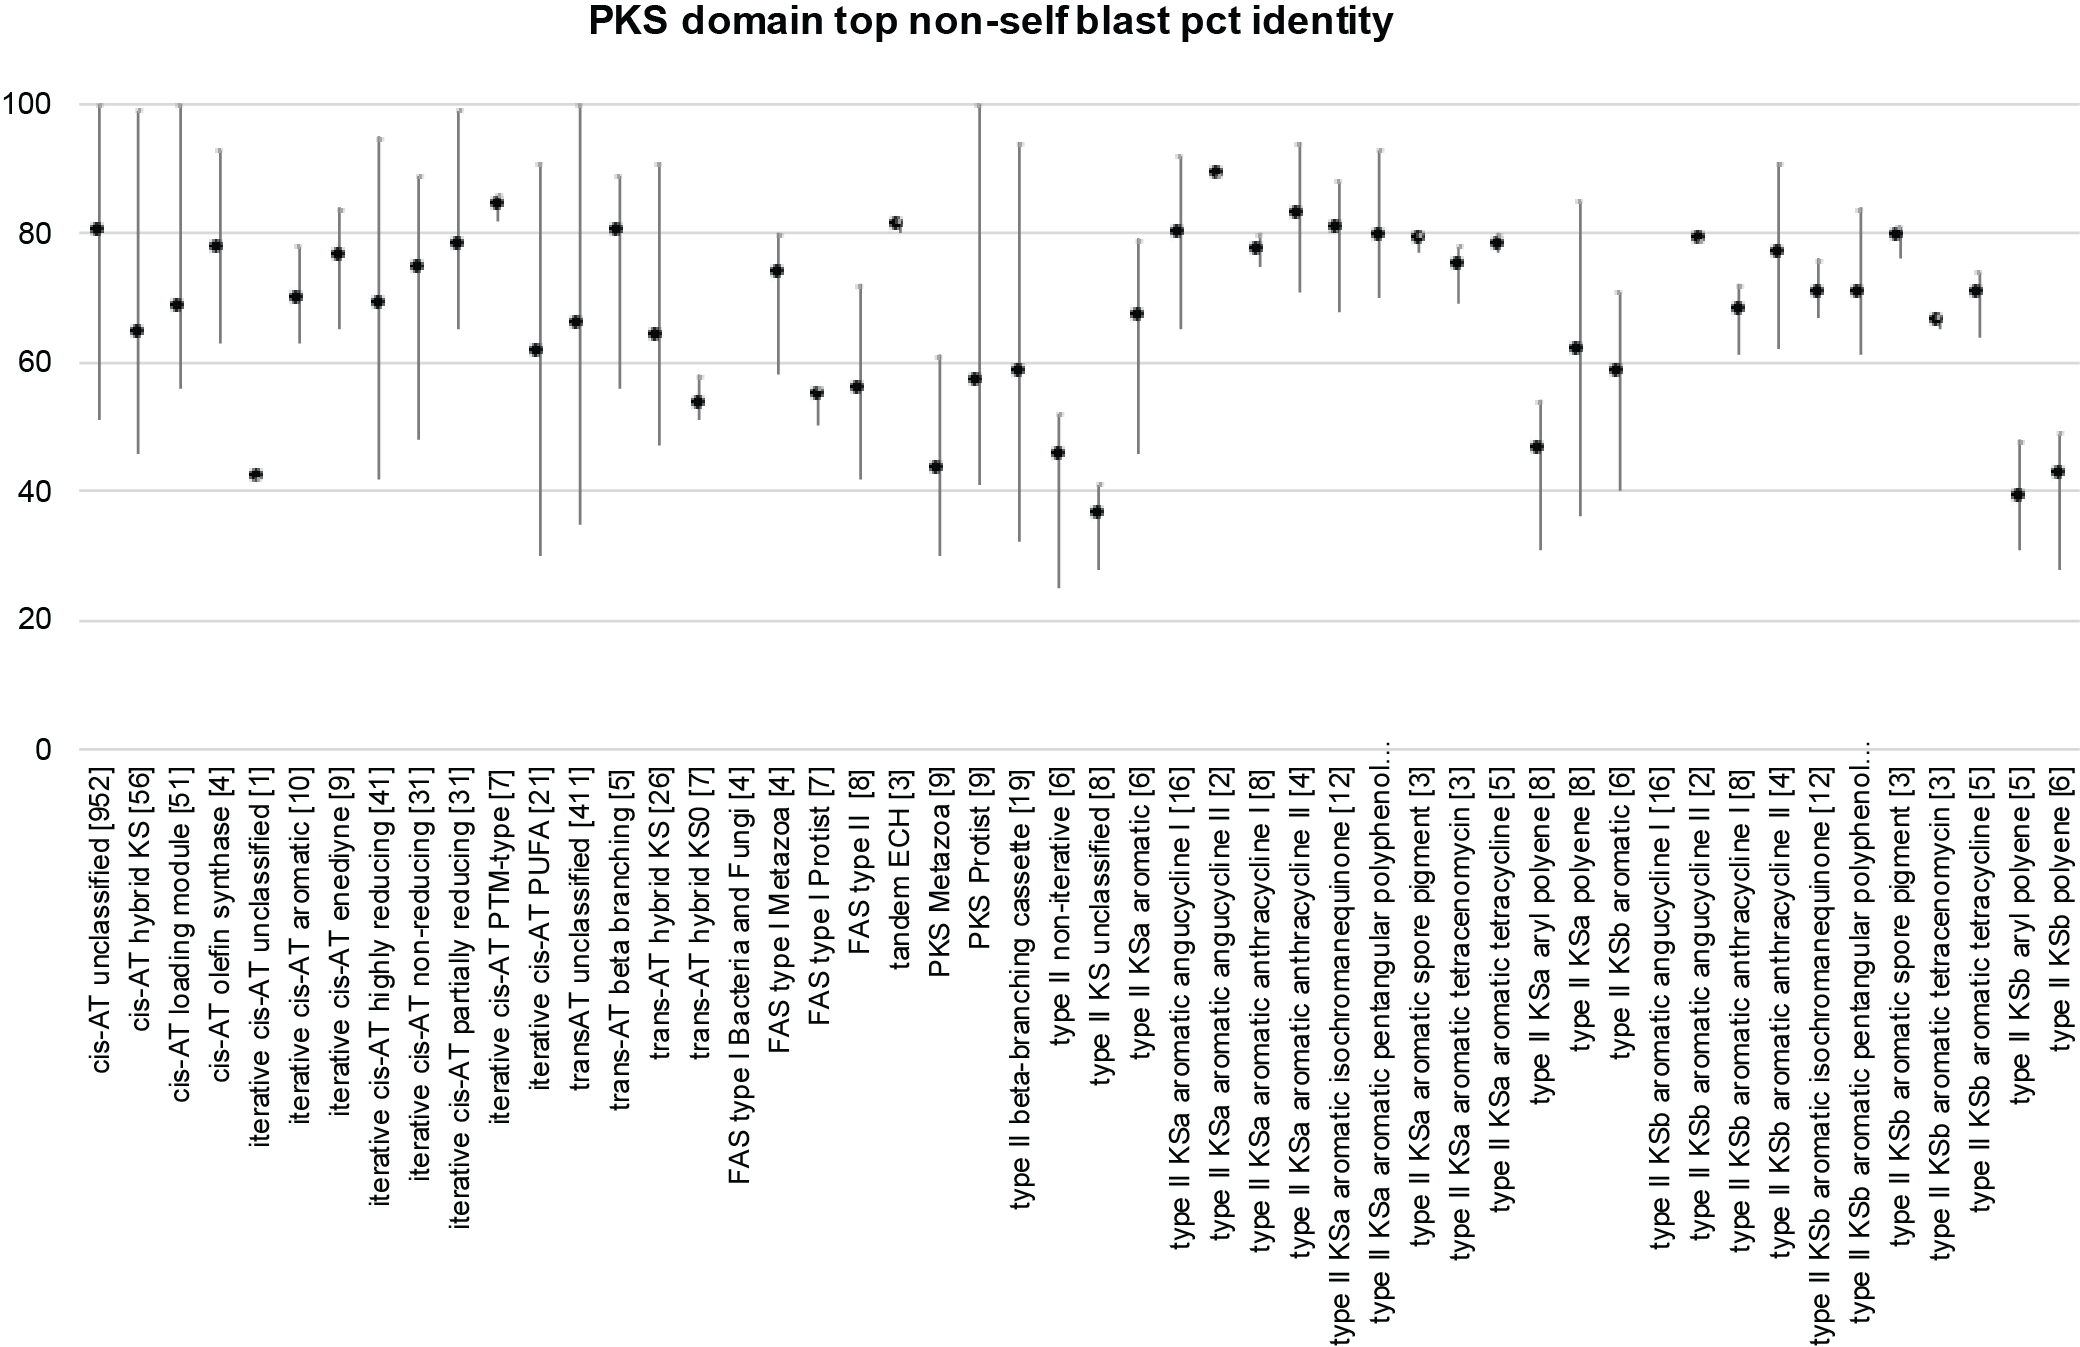
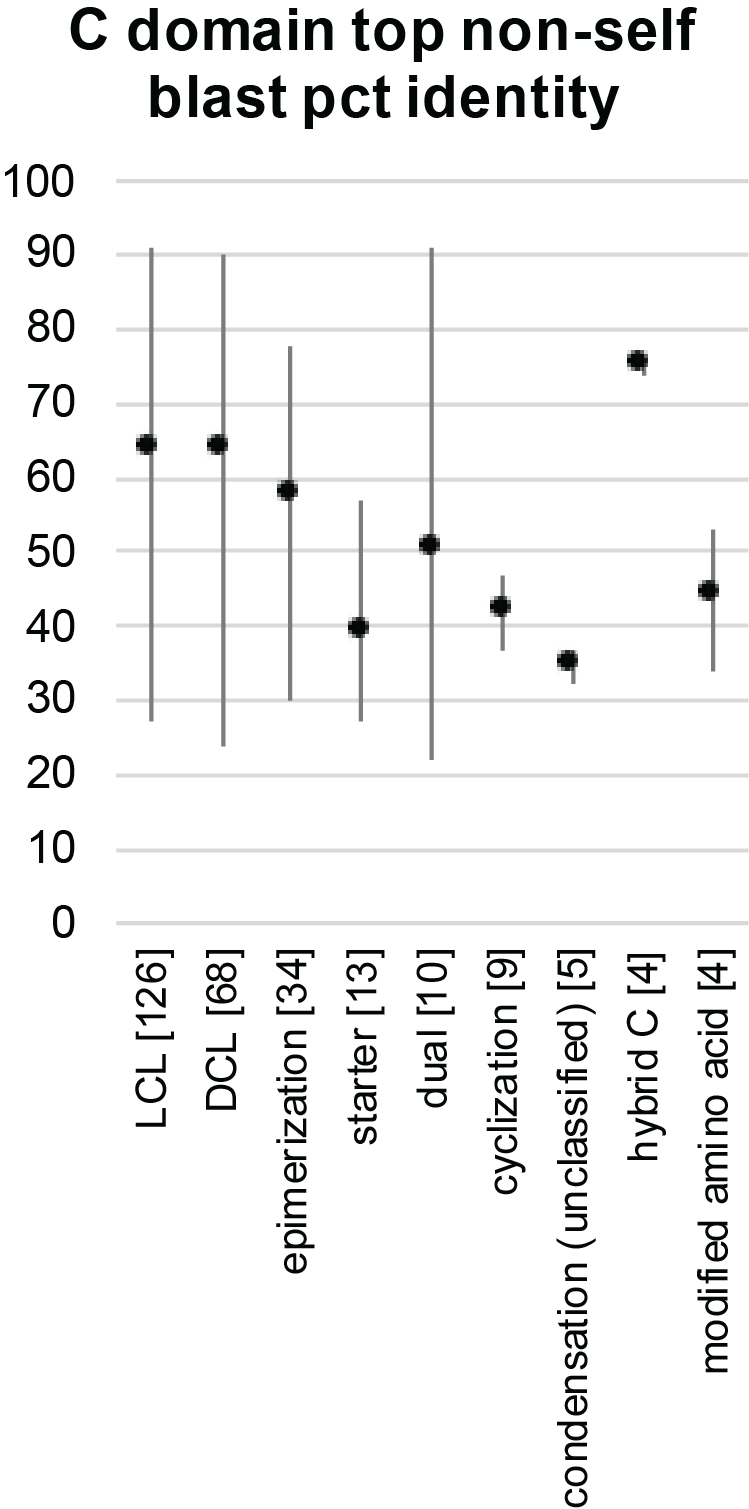
Typical amino acid percent identities vary widely within different functional domain categories, due at least partly to variability in the number and diversity of reference examples available. The following chart of leave-one-out (jack-knife) cross validation scores, shows averages and expected ranges for members of different functional classes. These values were obtained by finding the closest, non-self database match for each NaPDoS2 reference domain, and comparing amino acid match statistics to other members of the same functional classification category. Brackets after each category on the x-axis indicate the number of database reference sequences analyzed for that category.

ks_domain_class_blast_scores.png c_domain_class_blast_scores.png

BLASTP e-value cutoff scores

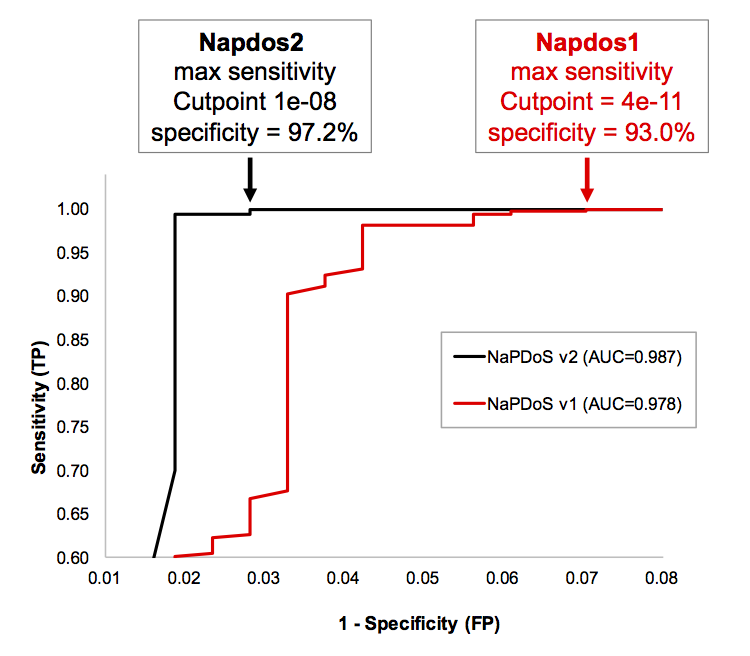
Recommended e-value settings for routine use are based on and Receiver Operating Characteristic (ROC) curves [4], calculated using leave-one-out (jack-knife) cross validation statistics for 213 non-redundant known positive and 308 negative control examples [5]. The default cutoff for NaPDoS version 2 has been set at 1e-8, an e-value that maximizes sensitivity with the minimum possible number of false positives. Users willing to accept higher false positive rates may select less stringent cutoff values using Advanced settings.


ROC_napdos1_vs_napdos2_detail.png

Sensitivity and accuracy versus alignment length

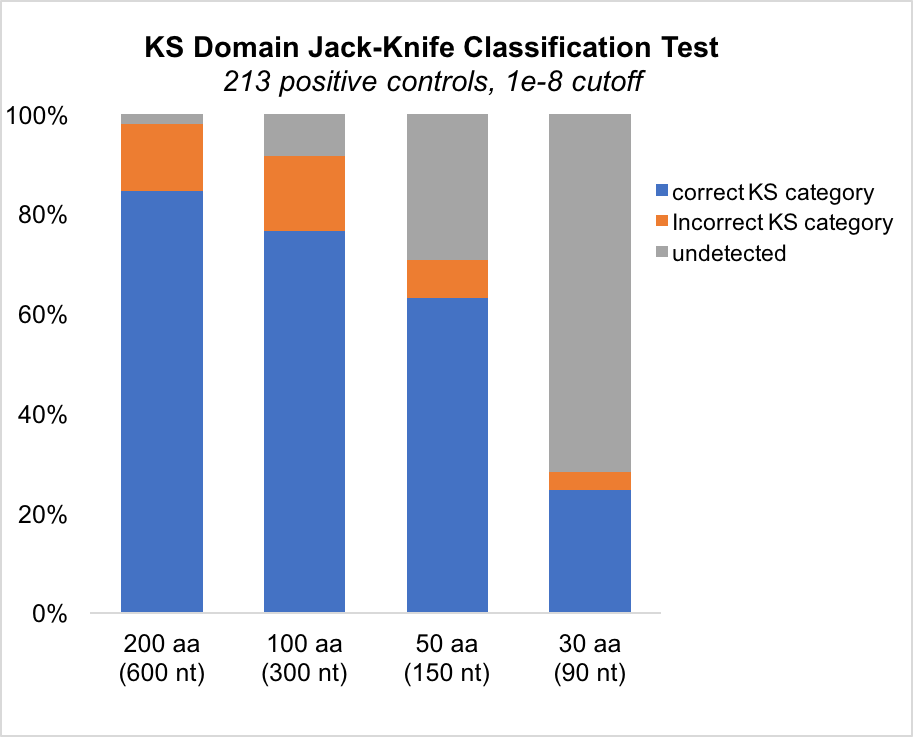
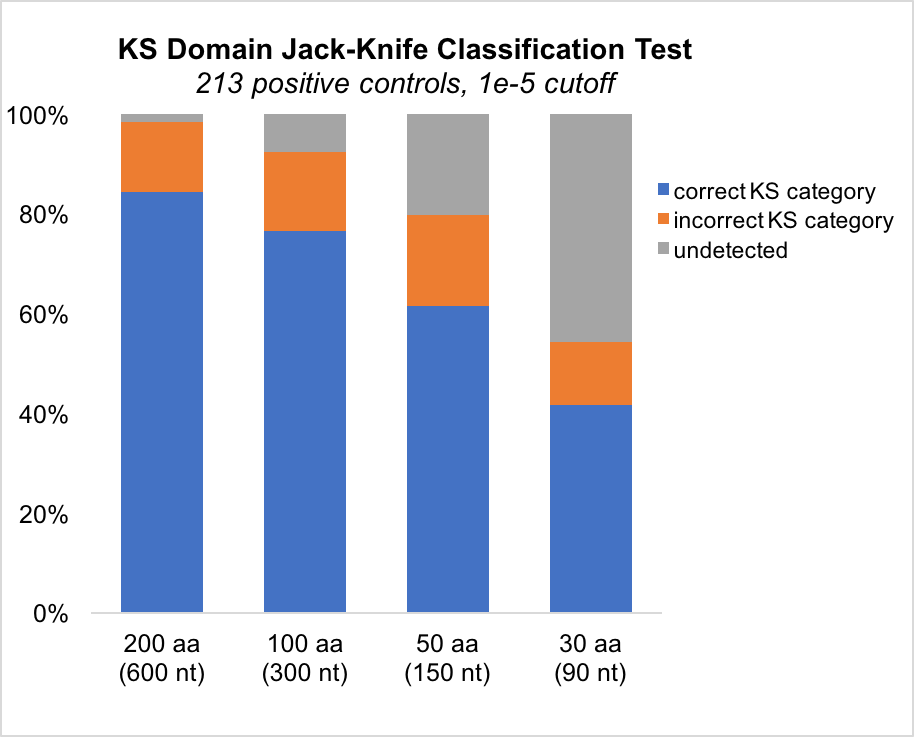
Default minimum alignment lengths for NaPDoS2 have been set at 50 amino acids, but users should be aware that genomic or metagenomic sequences covering randomly placed domain fragments cannot provide the same sensitivity and accuracy as full length KS and C domain sequences, which are typically around 425 amino acids (1275 nucleotides) long. Unassembled Illumina sequencing reads from genomes and metagenomes (typically < 150 nucleotides, or 30 translated amino acids) are poorly suited for obtaining useful PKS and NRPS domain predictions. PCR amplicons provide better sensitivity than random fragments, but, depending on their length, may still not enable accurate functional classification.

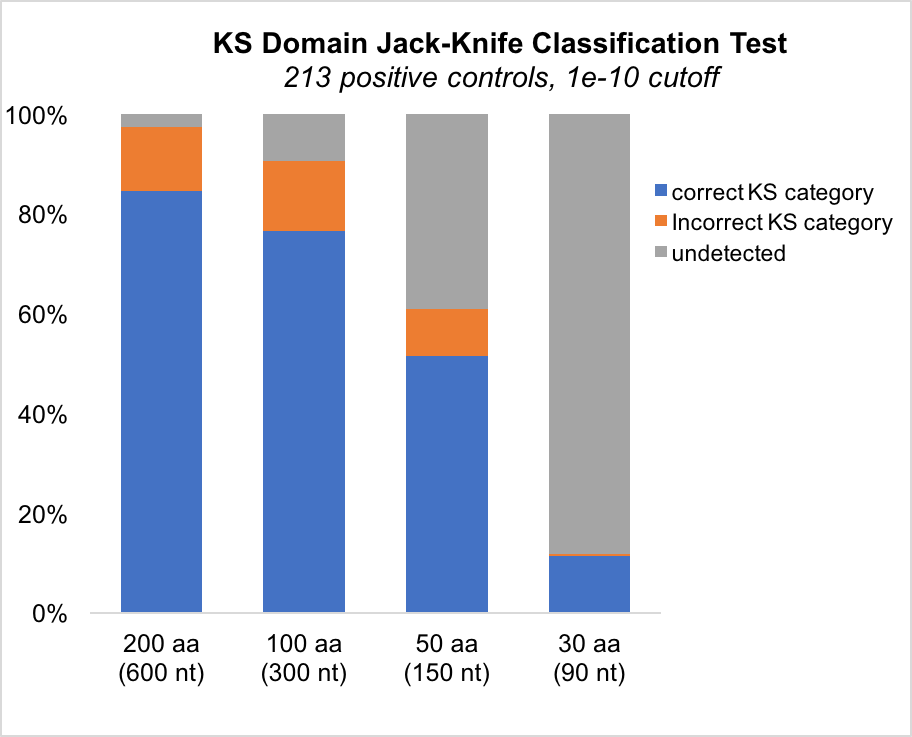
Large declines in sensitivity and classification accuracy were observed when full-length, non-redundant positive control domains were split into smaller, overlapping subsequences of less than 100 amino acids (300 nucleotides), as shown below. Relatively novel domain classes, with fewer available reference examples, were the ones most likely to be mis-classified in leave-one-out cross validation tests. Sensitivity declines can be partially offset by decreasing BLAST stringency, but this adjustment may also increase false positives and mis-classifications, depending on the nature of the data being analyzed [5].

new_images/category_accuracy_1e-10.png category_accuracy_1e-8.png category_accuracy_1e-5.

References

  1. Edgar RC: MUSCLE: multiple sequence alignment with high accuracy and high throughput. Nucleic Acids Res 2004, 32(5):1792-1797.

  2. Jenke-Kodama H, Sandmann A, Muller R, Dittmann E. Evolutionary implications of bacterial polyketide synthases. Mol Biol Evol. 2005 Oct;22(10):2027-39.

  3. Guindon S, Gascuel O: A simple, fast, and accurate algorithm to estimate large phylogenies by maximum likelihood. Syst Biol 2003, 52(5):696-704.

  4. Goksuluk D, Korkmaz S, Zararsiz G, Karaağaoğlu AE (2016). easyROC: An Interactive Web-tool for ROC Curve Analysis Using R Language Environment. The R Journal, 8(2):213-230.

  5. Habener LA, Podell S, Creamer, CE, Demko, AM, Allen, E, Moore, BM, Ziemert N, Letzel AC, Jensen PR. The Natural Product Domain Seeker (NaPDoS) version 2: Relating ketosynthase phylogeny to biosynthetic function. (in preparation)